For owners who may be new or unfamiliar with the Tesla Roadster, I'll run through the basic information needed to preserve this rare and special vehicle.
The most obvious concern is properly maintaining the battery pack. If the Roadster is left unattended and without power for weeks or months, the battery back will slowly discharge until the pack is fully depleted. If this happens, the battery pack may be ruined. Even if plugged in, if power is interrupted by a popped breaker, extended outage, service disconnection, etc., permanent damage to the battery pack can occur.
Also of concern is temperature. The Roadster should not be left unplugged in extreme temperatures. If the battery pack gets hot, it should be plugged in so it can cool. Consult the owners manual for more information.
Charging
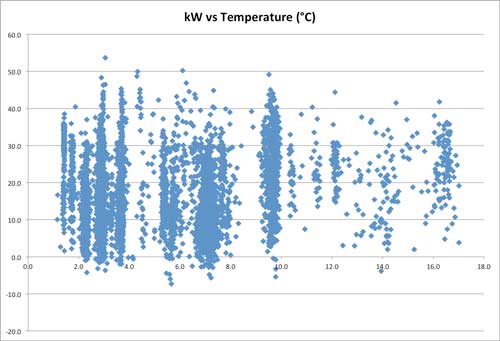
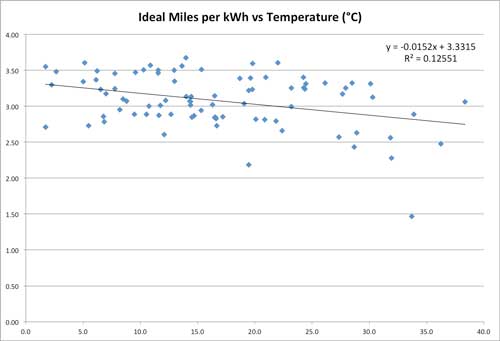
Level 1 In the United States and Canada, the Roadster can be charged at 120V with a simple cord sold as the MC-120. It just connects the car to power with no EVSE logic and the car assumes a 15A circuit suitable for charging at 12A. At this power level, the car can't run the full cooling system and in fact uses a lot of the power just to run the coolant pump. This means a slow rate of charge, and in fact in hot weather, may use all of the power just trying to cool the battery pack. In comfortable weather, not too hot and not too cold, and no rush to get charged, this can be an effective way to charge. Some owners used Level 1 exclusively. Since the coolant pump tends to run continuously, even after charging is complete, there may be a corresponding reducing in the lifetime of the coolant pump.
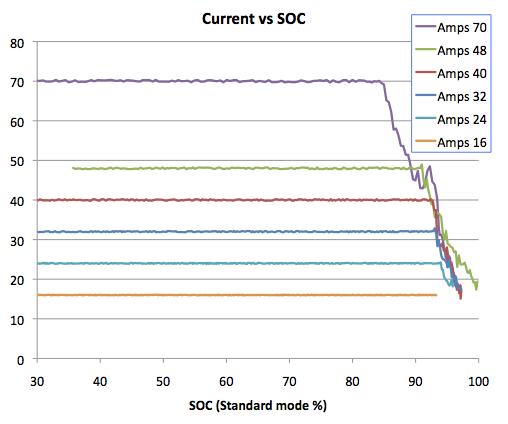
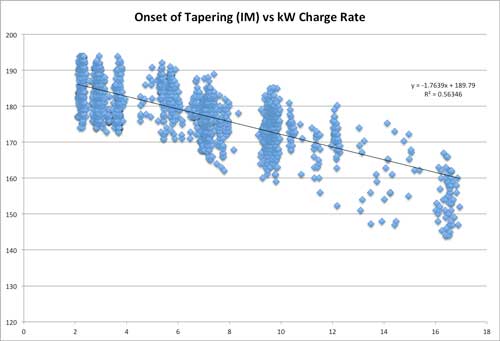
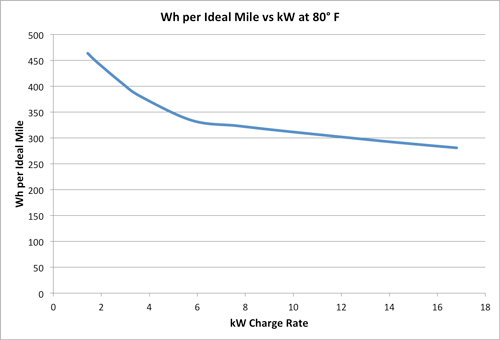
Level 2 charging means connecting to 240V single-phase power using an EVSE that communicates the maximum current draw allowed for the circuit. It uses the same communication protocol as standard J-1772 charging stations. Having more power means the battery pack can be better thermally managed, which can make quite a bit of noise when the fans, compressor and pumps are all going full tilt. The maximum charge rate of the Roadster is 240V/70A. Unless we were in a hurry on a road trip, we generally charged at 240V/32A which yields good energy efficiency and may be nicer to the battery.
The Roadster can charge from a standard J-1772 station with an appropriate adapter. Tesla sold one for a while and there's an aftermarket adapter.
Charge Modes
The Roadster has four charge modes, used for different purposes.
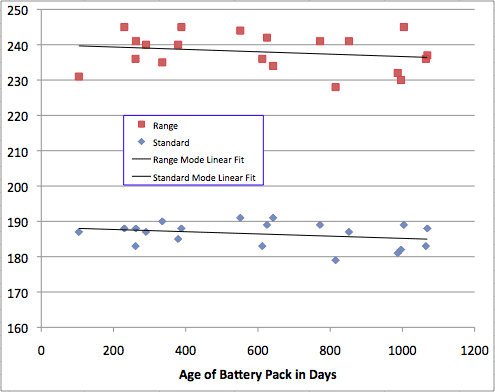
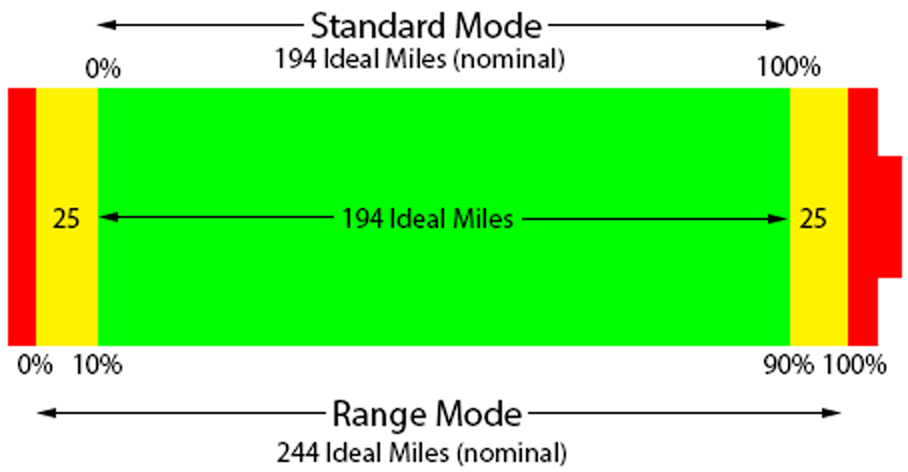
Standard Mode limits charging to the middle 80% of the battery pack, not letting the charge level get too high and warning the driver, and even shutting the car down, before getting critically low. This is the mode used for daily charging of a Roadster that's driven locally with some regularity.
Range Mode opens up the full charging range, allowing a higher state of charge and enables driving down to a lower start of charge. Range mode also limits power from the pack, and thus reducing maximum acceleration in the name of extending range. Occasional range mode charging didn't seem to have a negative effect on our battery pack, but charging frequently to the top of range mode may accelerate the loss of battery capacity. When we owned a Roadster, we'd do a full range mode charge at the start of long road trip, then switch over to standard mode for driving.
Performance Mode uses the full charging range, allows the battery to get warmer while charging, and allows maximum power (full acceleration). This is appropriate for driving on a track, but probably accelerates loss of battery pack capacity if used often.
Storage Mode displays the state of charge like Standard Mode, but will let the state of charge drop to around 30% then will maintain that level of charge. This is the best mode to use when the Roadster won't be driven for weeks or months. The car must be plugged in to maintain the health of the battery pack. The disadvantage of Storage Mode is that if the power supply is interrupted, it will start discharging from around 30%, so it will get into trouble sooner than if left in Standard mode. That's probably more of a concern if it's in long term storage and ignored vs. being kept for the winter in your garage where you'll notice of the power goes out or the breaker gets tripped.
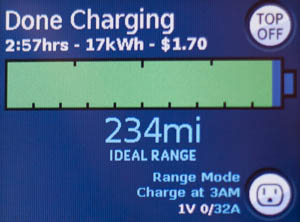
An example charge screen:
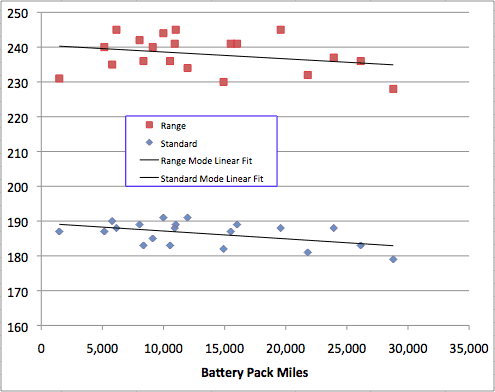
The drawing below shows how to interpret the state of charge in the two main charge modes. Range values are for the original 53 kWh battery pack when new.
Vehicle Log
The Roaster maintains a detailed internal log which can be downloaded via the USB port in the console. Although the format of the logs isn't documented by Tesla, various owners have been able to decode and extra a great deal of data. The log file has two sections: a long term section that has basic info and a more detailed section of recent driving and charging. See the page on the VMSParser I created for more information.
Remote Monitoring
The Roadster did not have support for remote monitoring, not at all for the 2008 (v1.5) Roadster and nothing driver-accessbile for the 2009 and later (v2) Roadster.
There is an aftermarket system availble, the Open Vehicle Monitoring System or OVMS. OVMS allows for remote monitoring of charging, GPS tracking, custom charge settings, and viewing battery metrics. In addition to allowing manual remote monitoring, it can also send low-battery alerts and unexpected motion alerts if the car moves not under its own power.
More Resources
There are a number of other entries on the blog detailing our adventures with the Roadster, plus another collection of longer Roadster articles of practical and historical interest.
The Tesla Motors Club forum is the best community resource around, although its focus has natually shifted to the newer Tesla vehicles.
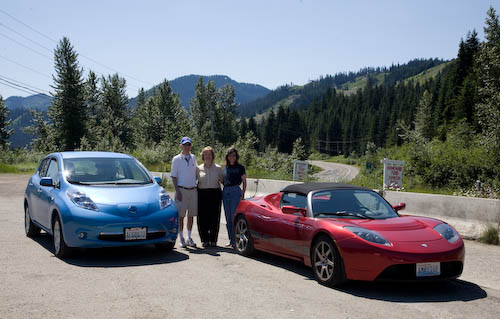
 Today, October 23, 2017, Jose pulled up in front of our house in a beautiful blue Nissan LEAF for our test drive. We spent about an hour going over the vehicle and then out for a drive. Jose was enthusiastic and very knowledgeable about the car. We have a 2011 LEAF, so I'm familiar with that but haven't driven any of the newer LEAFs, so that's my perspective.
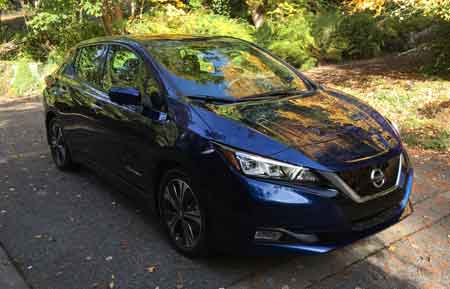 Back Seat
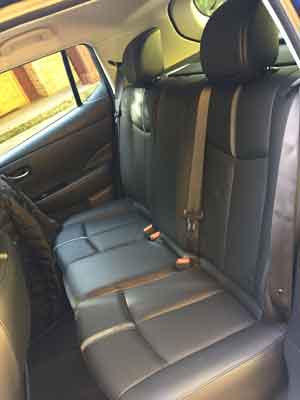 Charge Cord
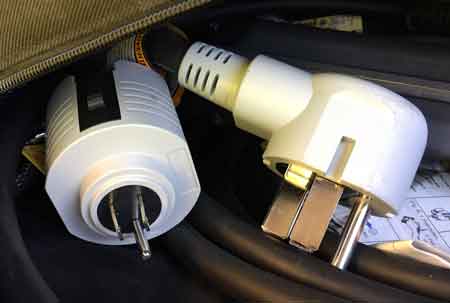 With so much public charging available now, there's not much need for Level 2 charging away from home, but the dual mode cord means an owner can upgrade their home charging to 240V by just installing a NEMA 15-40 outlet.
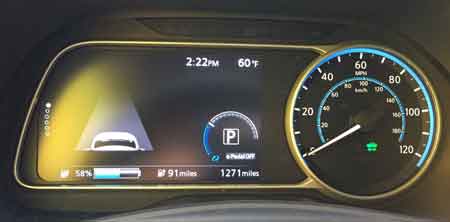 ProPilot
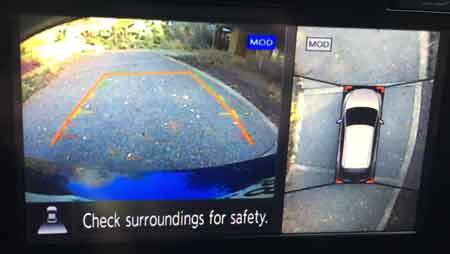 Bluetooth Audio
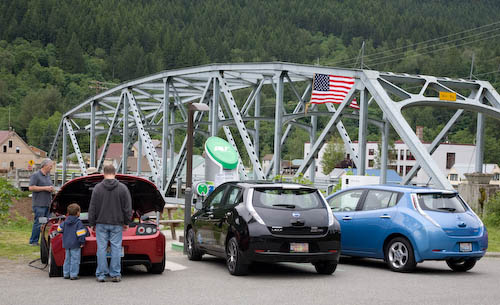
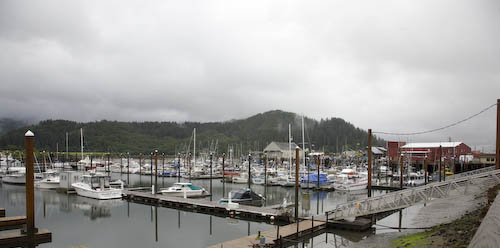
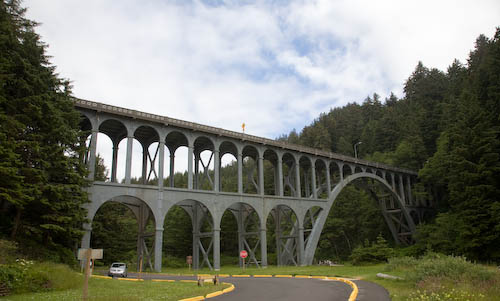
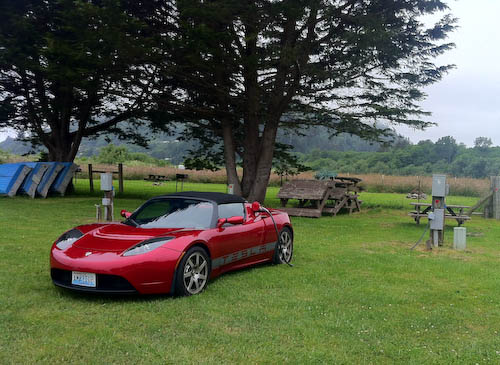
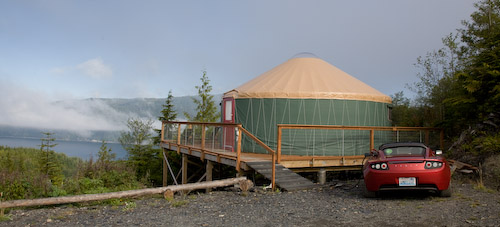
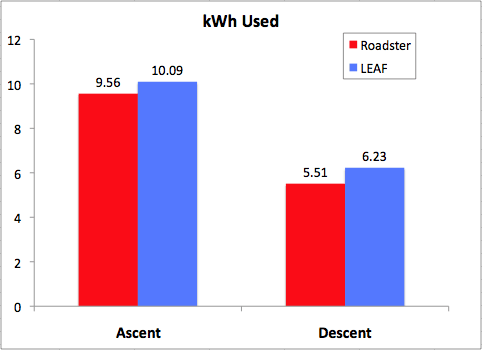
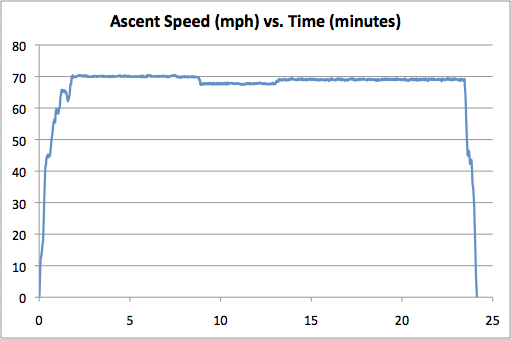
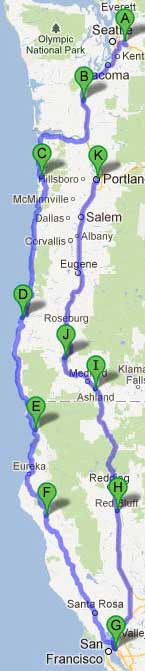 Cathy and I took an 1,823-mile electric vehicle road trip to attend the Plug In America board meeting in Berkeley, CA, on June 23rd, 2012. Ever since we took delivery of our Tesla Roadster in June of 2009, I've wanted to take it on a long road trip just to have the experience. Over the past three years, the challenge of making the drive from Seattle to California has been greatly reduced. When Rich Kaethler took delivery of his Roadster in San Carlos, CA, and drove it back to Seattle in August of 2009, and Chad Schwitters made his long trek from Seattle to San Diego and back in April of 2010, these were pioneering efforts. Now we have full speed (240V/70A) Tesla charging along I-5 from British Columbia to southern California, which makes it possible to do the Seattle-to-San Francisco drive electrically in just a couple of days.